Per capita spending growth in employer plans is outpacing that in Medicare
31
States saw faster growth in per-enrollee costs in employer plans than in Medicare between 2013 and 2016
Stalled progress in expanding health insurance coverage and access to care relates to rising health care costs as well as state and federal policies. In particular, the costs of private health plans are rising and people covered by such plans are increasingly exposed to high deductibles and out-of-pocket costs. As of the end of 2018, 30 million adults remained uninsured and an estimated 44 million people had insurance but had such high deductibles and out-of-pocket costs relative to their income that they were considered to be underinsured.11 People with individual-market plans were underinsured at the highest rates, but the greatest recent growth occurred among people with employer plans.
A key factor in both uninsured and underinsured rates is the overall rate of growth in U.S. health care costs, especially compared with slow growth in U.S. median income. Health care costs are the primary driver of premium growth in private insurance. Insurers and employers have tried to lower premiums by increasing deductibles and other cost-sharing for enrollees. Health care costs thus ultimately drive both consumers’ decisions about whether to enroll in insurance and whether to get health care.
Employee premium contributions are high relative to median income in many states
More than half of the U.S. population under age 65 — about 158 million people — get their health insurance through an employer.12
The amount that employees contribute to their employer coverage is rising faster than median income in most states.13 In 2017, employee premium contributions as a share of median income was 7 percent nationally (Appendix C2). This share increased in 19 states by 0.6 percentage points or more between 2013 and 2017, meeting the Scorecard’s definition of worsening. Earlier research indicates that these higher premiums are not buying more generous health plans; deductibles are also growing in most states.14
Families spending the largest amount of their income on employer premiums live in the South and Southwest. In 11 states (Arizona, Delaware, Florida, Georgia, Louisiana, Mississippi, Nevada, New Mexico, North Carolina, Oklahoma, and Texas), premium contributions were 8 percent of median income or more, with a high of 10.2 percent in Louisiana (Exhibit 9, Appendix C2).
In 11 states, average employee health insurance contributions were 8 percent of median income or more in 2017
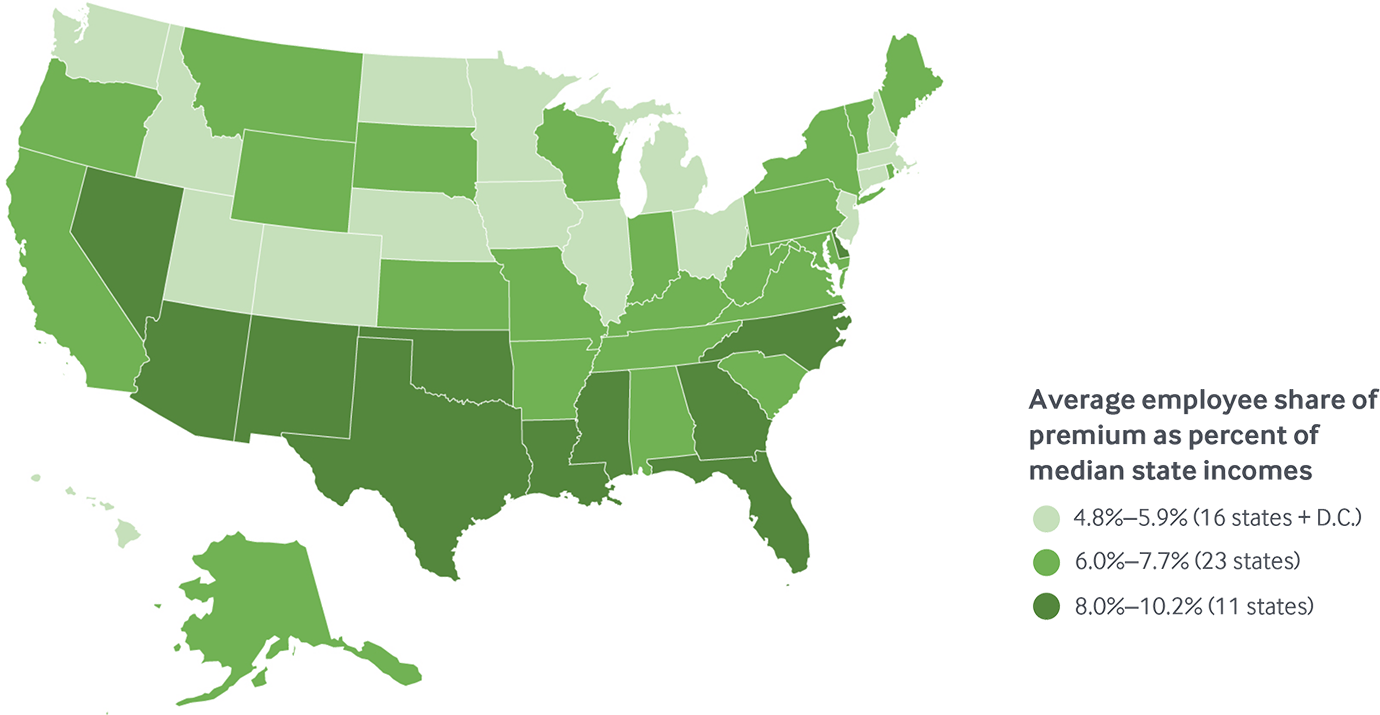
Data: Employee premium share: Medical Expenditure Panel Survey–Insurance Component (MEPS-IC, 2017); Median household income: Current Population Survey (2017–18).
Share
States with higher employer premiums also have higher health care costs
States with the highest average employer premiums (both employer and employee contributions) also tended to have the highest per-enrollee health care costs (Exhibit 10). Medical costs comprise the largest share of premiums (80% to 95%), so it is not surprising that states with higher costs also had higher premiums.
What accounts for state variation in costs and premiums in employer health plans? There is growing evidence that prices paid by private insurers to health care providers, especially hospitals, rather than people’s use of health care services, are the primary driver of cost and premium growth.15 For example, the Health Care Cost Institute recently found that between 2013 and 2017, prices for inpatient services paid by private insurers climbed by 16 percent while utilization fell by 5 percent.16 The analysis found similar patterns for outpatient and professional services as well as prescription drugs.
There is also evidence that prices explain the wide health care spending gap between the United States and other wealthy countries.17 Other research has found that greater spending in the United States does not result in better health outcomes than in countries that spend less.18
Higher premiums for employer coverage is associated with higher per-person spending, 2016

Note: X- and Y-axes do not start at $0. Abbreviations left off some states clustered near the U.S. average for legibility.
Data: Employer coverage per-enrollee spending: 2016 Truven MarketScan Database, analysis by Michael E. Chernew, Harvard Medical School; Premiums for employer coverage: Medical Expenditure Panel Survey–Insurance Component (MEPS-IC, 2017).
Share
Per-enrollee costs grew faster in employer plans than in Medicare in most places
Recent research indicates that per capita costs in private insurance are rising faster than those in Medicare and that prices are a likely culprit. Cooper and colleagues found that between 2007 and 2014, health spending per insured enrollee in employer plans increased more rapidly and showed much more variability than per-beneficiary spending in Medicare.19 Medicare sets prices for providers while prices in private plans are usually the result of confidential negotiation between providers and insurers or employers. A recent RAND analysis of a sample of hospitals in 25 states found that case-mix adjusted hospital prices paid by private insurers and employers were 241 percent higher than Medicare prices in 2017.20
Our analysis of another database of employer health insurance claims identified similar patterns across regions. Growth in per-enrollee spending among working-age adults with employer coverage outpaced growth in per-enrollee Medicare spending between 2013 to 2016 in five of eight regions. Differences were widest in the Mid-Atlantic and Great Lakes states (Exhibit 11, Appendix E2).
Growth in per-enrollee spending among adults with employer insurance outpaced per capita Medicare spending growth
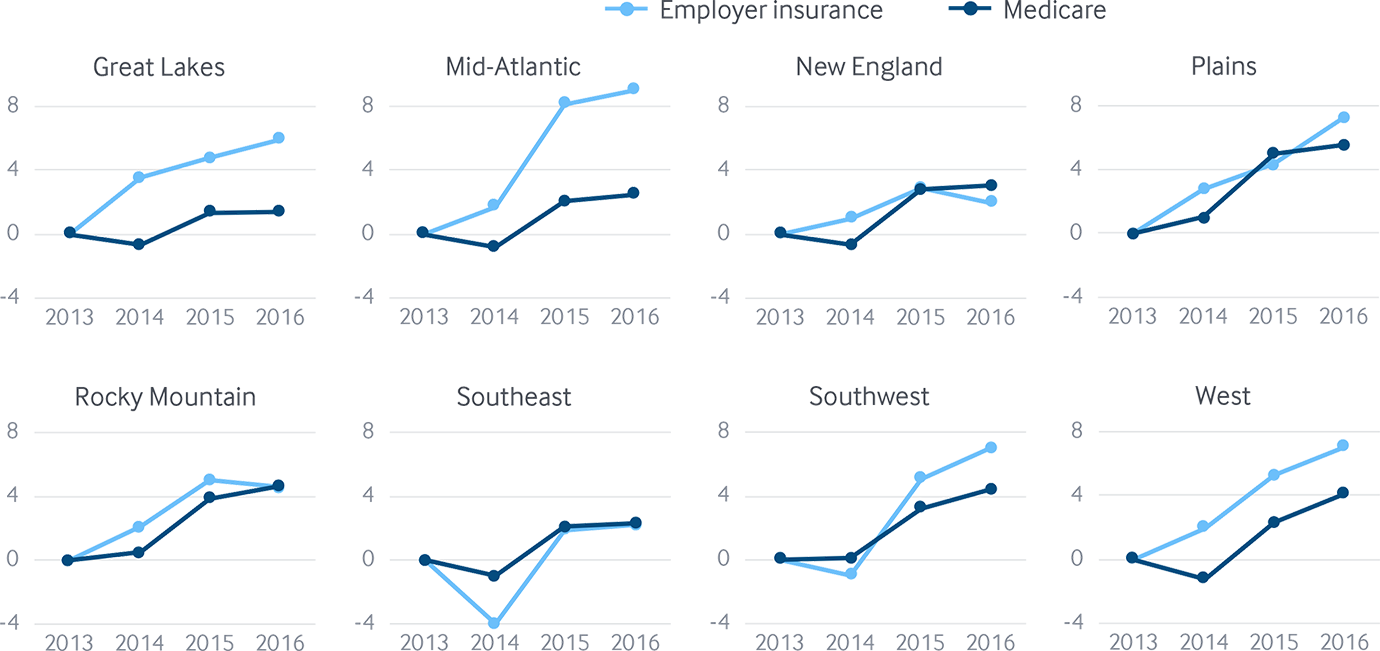
Data: Employer coverage: 2016 Truven MarketScan Database, analysis by Michael E. Chernew, Harvard Medical School; Medicare: 2016 administrative claims via May 2018 CMS Geographic Variation Public Use File.
Share
Growth in per-enrollee costs grew faster in employer plans than in Medicare in 31 states
Our analysis of cost trends at the state level between 2013 and 2016 found that per-enrollee spending growth in employer plans outpaced that of Medicare in 31 states. Per-beneficiary spending in Medicare climbed by 2.5 percent nationally, but ranged from a 1.5 percent decrease in Ohio to a 12.1 percent increase in Alaska (Exhibit 12, Appendix E2). Alaska was the only state where the growth rate exceeded 10 percent.
Per-enrollee spending among adults with employer coverage grew 3.9 percent between 2013 and 2016, but with more variation across states (Appendix E2). Per-enrollee spending increased by 10 percent or more in nine states, ranging from 10.1 percent in Wyoming to 16.2 percent in Alaska. Spending decreased in nine states, ranging from a drop of 18 percent in Mississippi to a decline of 1.2 percent in Massachusetts.
Cumulative change in per enrollee spending, 2013–2016
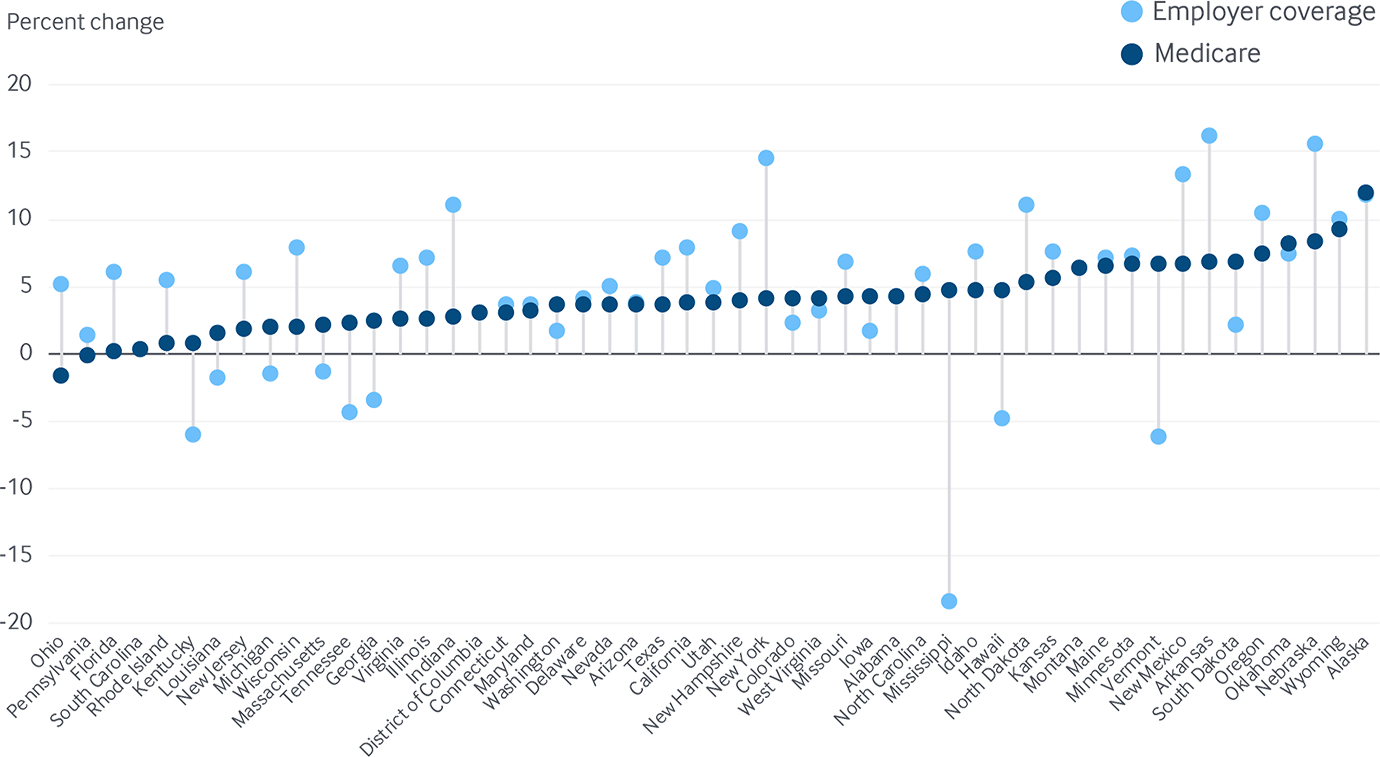
Data: Employer coverage: 2013–2016 Truven MarketScan Database, analysis by Michael E. Chernew, Harvard Medical School; Medicare: 2013–2016 administrative claims via May 2018 CMS Geographic Variation Public Use File.
Share
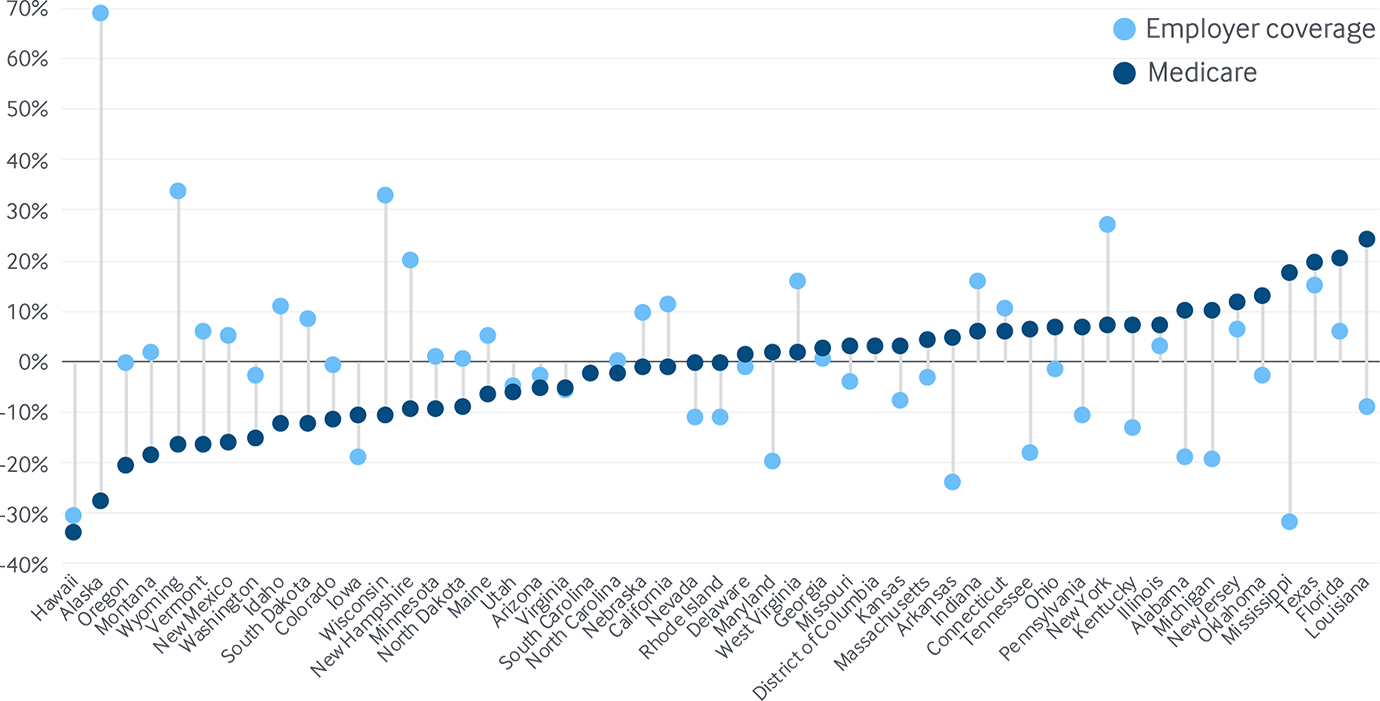
Differences in prices paid to providers likely drive much of the interstate variation in employer health plan costs and premiums
What drives the considerable variation in per-enrollee spending levels in Medicare and employer plans? Exhibit 13 compares spending among Medicare beneficiaries and those with employer coverage in the same state. Spending for each group is shown as the degree to which it diverges from the U.S. median.
Per-enrollee Medicare spending in Hawaii was 34 percent less than the U.S. median, whereas spending was 24 percent higher than the median in Louisiana. In employer plans, spending per member in Alaska was nearly 70 percent higher than the U.S. median, while in Mississippi per-member spending was about 30 percent lower than the median.
Since prices are fixed in the Medicare program with adjustments such as hospital type and regional characteristics, most of the state variation in per-beneficiary Medicare spending arises from differences in the amount of services beneficiaries in each state use.21 In contrast, recent research suggests that much of the observed variation in per-enrollee spending in private health plans may stem from provider price variation resulting from local contract negotiations.
Per-enrollee spending among adults with employer coverage and Medicare, relative to the U.S. median for each group, 2016
Data: Employer coverage: 2016 Truven MarketScan Database, analysis by Michael E. Chernew, Harvard Medical School; Medicare: 2016 administrative claims via May 2018 CMS Geographic Variation Public Use File.