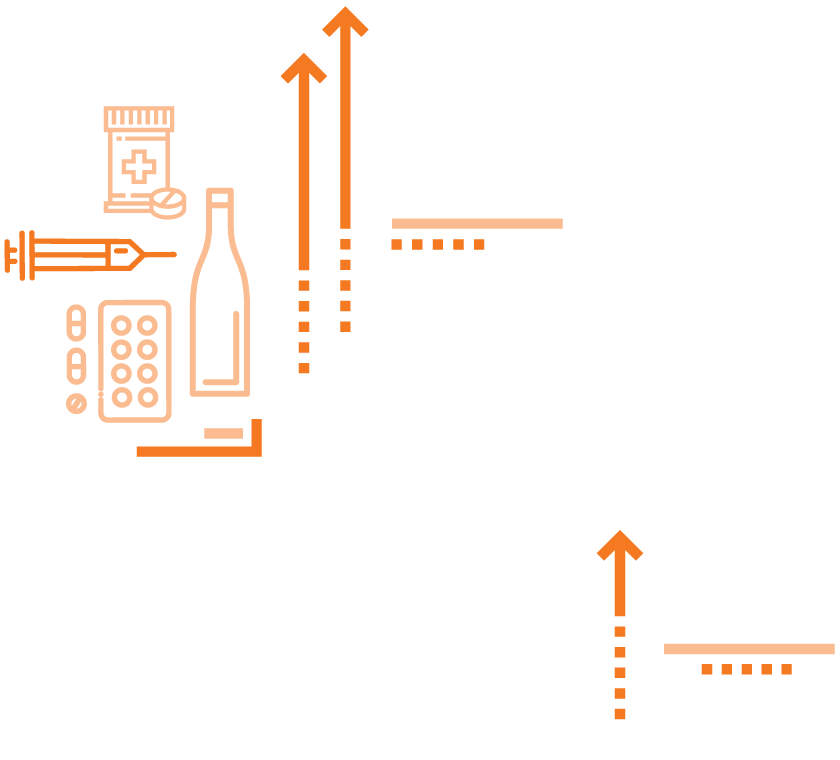
The rise in deaths from suicide, alcohol, and drug overdose is a national crisis, but states are affected in different ways
3x
Rise in drug overdose deaths in 11 states between 2005 and 2017
By now, we are all too aware of the devastating effects of the opioid crisis. Opioid use disorder, as well as the emergence of highly lethal synthetic opioids (e.g., fentanyl and carfentanil) in the illicit drug supply, have fueled a rise in drug overdose deaths that have affected families across the country. Drug overdose deaths are part of the term “deaths of despair,” which also refer to deaths from suicide and alcohol.1 Together, rising death rates from suicide, alcohol, and drug overdose contribute to the recent decline in average life expectancy at birth in the United States.2
Deaths from suicide, alcohol, and drug overdose manifest differently across states
What’s often lost in national discussions about the increase of deaths from suicide, alcohol, and drug overdose is that different states have been affected in different ways.
States in New England, the Mid-Atlantic, and several Southeastern states have been particularly hard hit by the opioid epidemic (Exhibit 1).3 West Virginia, Ohio, Pennsylvania, the District of Columbia, Kentucky, Delaware, and New Hampshire stand out as having the highest death rates from drug overdoses. In Pennsylvania, Maryland, and Ohio, mortality rates from drug overdoses were at least five times higher than rates for alcohol-related deaths and about three times higher than suicide rates (Appendix F3).
In other states, deaths from suicide and alcohol dominate. In 2017, Montana, Nebraska, the Dakotas, Oregon, and Wyoming saw higher rates of death from suicide and alcohol than from drugs. In 13 additional states, either suicide or deaths from alcohol (but not both) surpassed drug overdose deaths.4
Deaths from suicide, alcohol, and drug overdose impact states differently
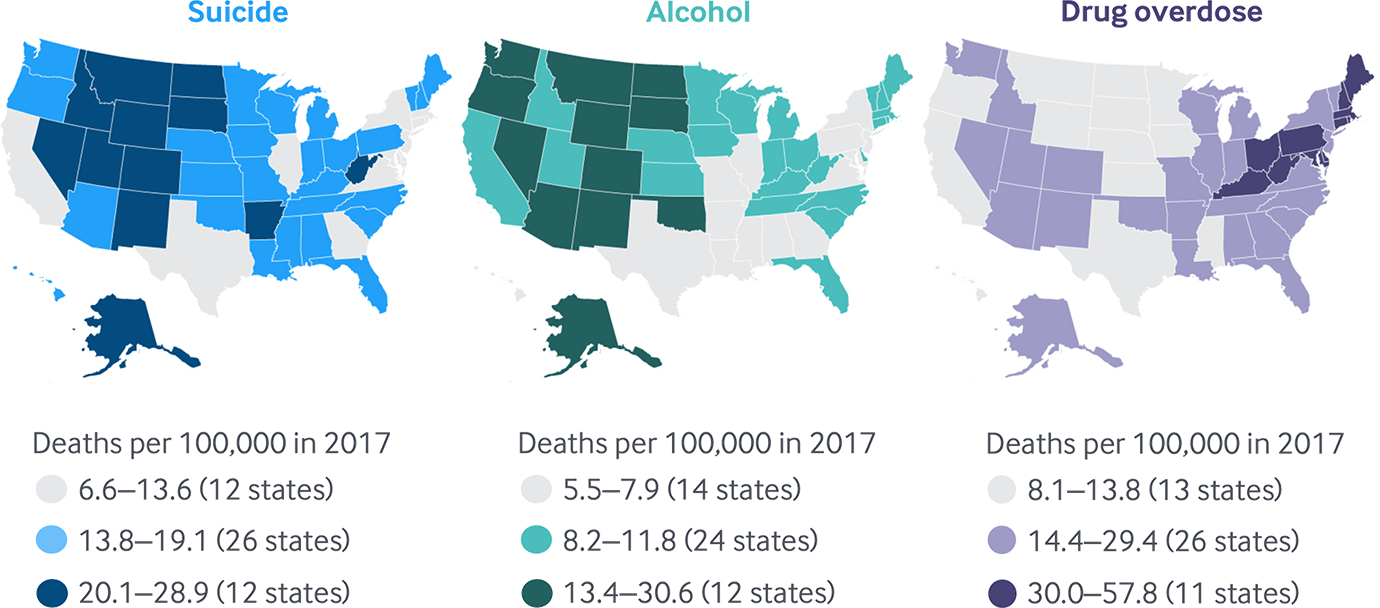
Note: D.C. not counted in state tallies.
Data: 2005–2017 National Vital Statistics System (NVSS), via CDC WONDER.
Share
West Virginia and Ohio have been hard hit by the opioid epidemic; drug-related mortality in those states far outpaces rates in other parts of the country
West Virginia has been hardest hit by the opioid epidemic.
It had the highest rate of drug overdose deaths in 2017 (57.8 deaths per 100,000 residents) — more than two-and-a-half times the national average and 25 percent higher than the next highest state, Ohio, which had 46.3 deaths per 100,000 residents (Exhibit 2). West Virginia has also seen the sharpest growth in drug overdose deaths in recent history, with overdose mortality rates climbing from 10.5 deaths per 100,000 in 2005 to 57.8 in 2017 — a fivefold increase. While West Virginia stands out, it’s hardly alone. Additionally, drug-related mortality rates in Ohio, Pennsylvania, and the District of Columbia were at least double the U.S. average in 2017, and along with seven other states, have seen at least a threefold increase in overdose mortality since 2005 (Appendix F3).
Drug overdose deaths unequal across states, disproportionately impact Ohio and West Virginia
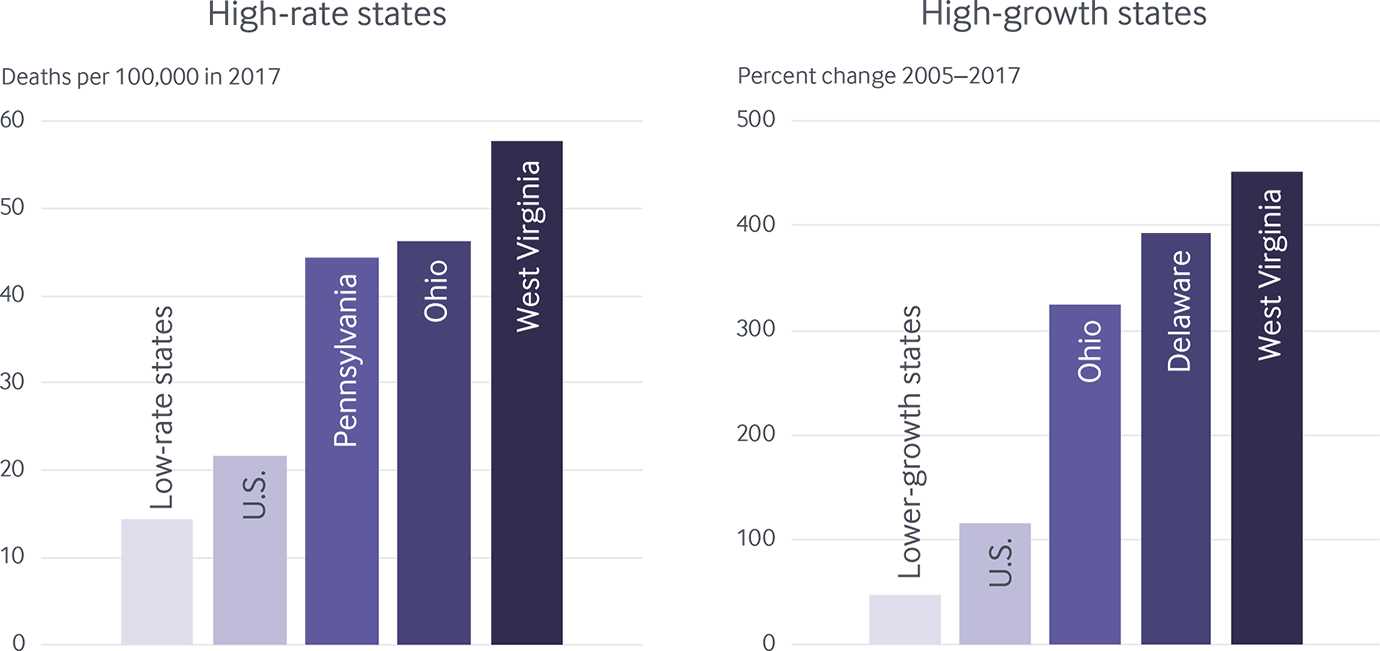
Note: “Low-rate” and “lower growth” refer to the median value among the group of states with rates below the U.S. average.
Data: 2005–2017 National Vital Statistics System (NVSS), via CDC WONDER.
Share
Growth trends: Deaths from suicide, alcohol, and drug overdose hit all-time highs in 2017
Nationally speaking, the death rates from suicide, alcohol, and drug overdose each rose markedly in the past decade. The recent, sharp growth in drug overdose deaths is most alarming. The rate of death from drug overdose more than doubled across the country between 2005 and 2017 (Exhibit 3, Appendix F3).5 While the overdose rate has somewhat moderated recently, the 10 percent jump between 2016 and 2017 is still among the highest annual increases the nation has seen.
Steady increases in suicides and deaths linked to alcohol are also concerning and represent yet another marker of complex socioeconomic and behavioral health problems across the nation. Nationally, suicide rates are up nearly 30 percent since 2005; they rose more sharply between 2016 and 2017 than during any other one-year period in recent history.6 Similarly, the rate of death linked to alcohol has increased more rapidly in recent years, with average growth of 4 percent per year between 2013 and 2017, compared with 2 percent per year between 2005 and 2012.
Deaths from suicide, alcohol, and drug overdose on the rise
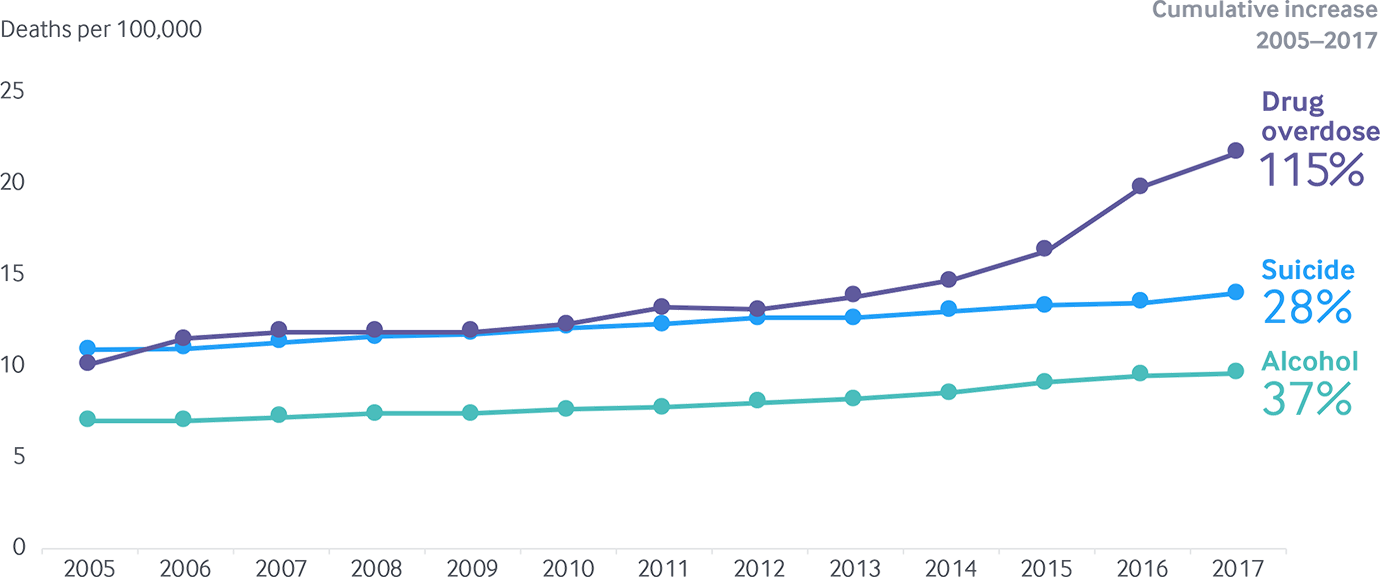
Data: 2005–2017 National Vital Statistics System (NVSS), via CDC WONDER.
Share
Growth trends: Uneven growth in death rates across states suggests varying approaches needed to stem suicide and alcohol- and drug-related mortality
Focusing on national growth trends can mask important differences in trends in deaths from suicide, alcohol, and drug overdose across states.
Deaths of each type rose in every state between 2005 and 2017, but the increases were far from uniform. Drug overdose mortality has risen the most, more than doubling in 26 states (Exhibit 4). States in New England, the Mid-Atlantic, the Great Lakes states, and several Southeastern and Plains states saw the most intense growth. Suicide and alcohol-related deaths also rose, but more modestly.
Growth in deaths from suicide, alcohol, and drug overdose differ across states
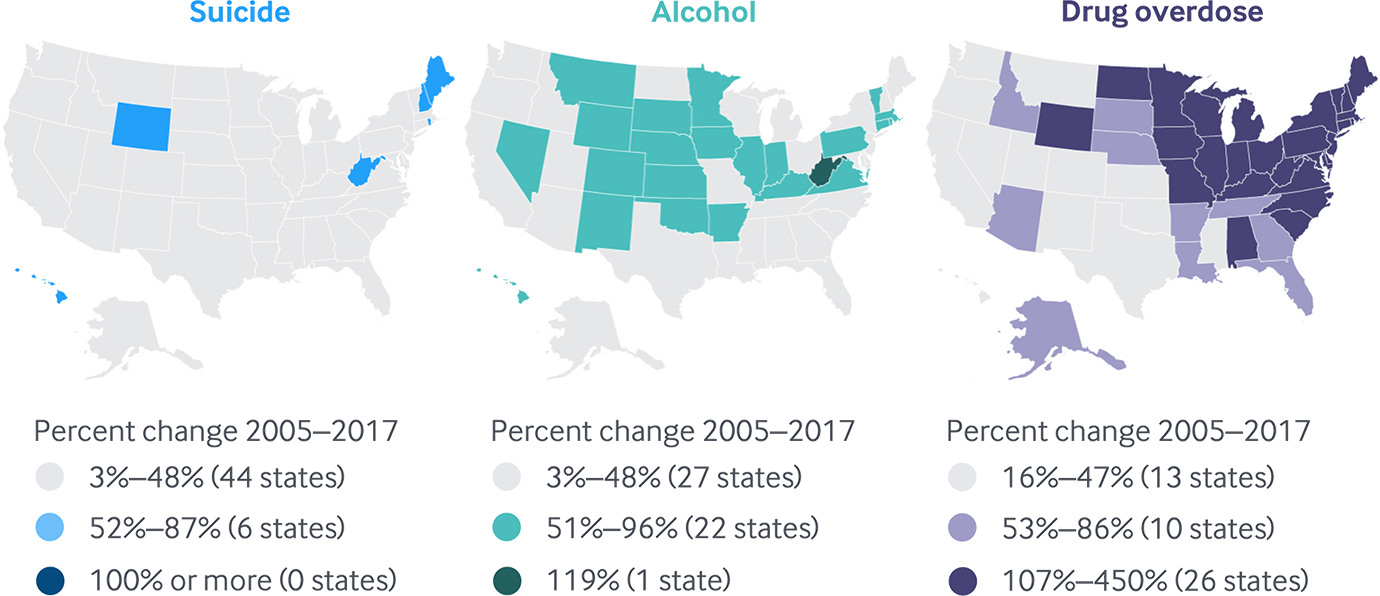
Note: Growth is measured as the percent change in deaths per 100,000 between 2005 and 2017. D.C. not counted in state tallies. Map categories are fixed for all three death causes at 0%–49% increase, 50%–99% increase, and 100% or more increase.
Data: 2005–2017 National Vital Statistics System (NVSS), via CDC WONDER.